")
The Wateranga resource is based on over 300 reverse circulation drillholes. See Figure 1.
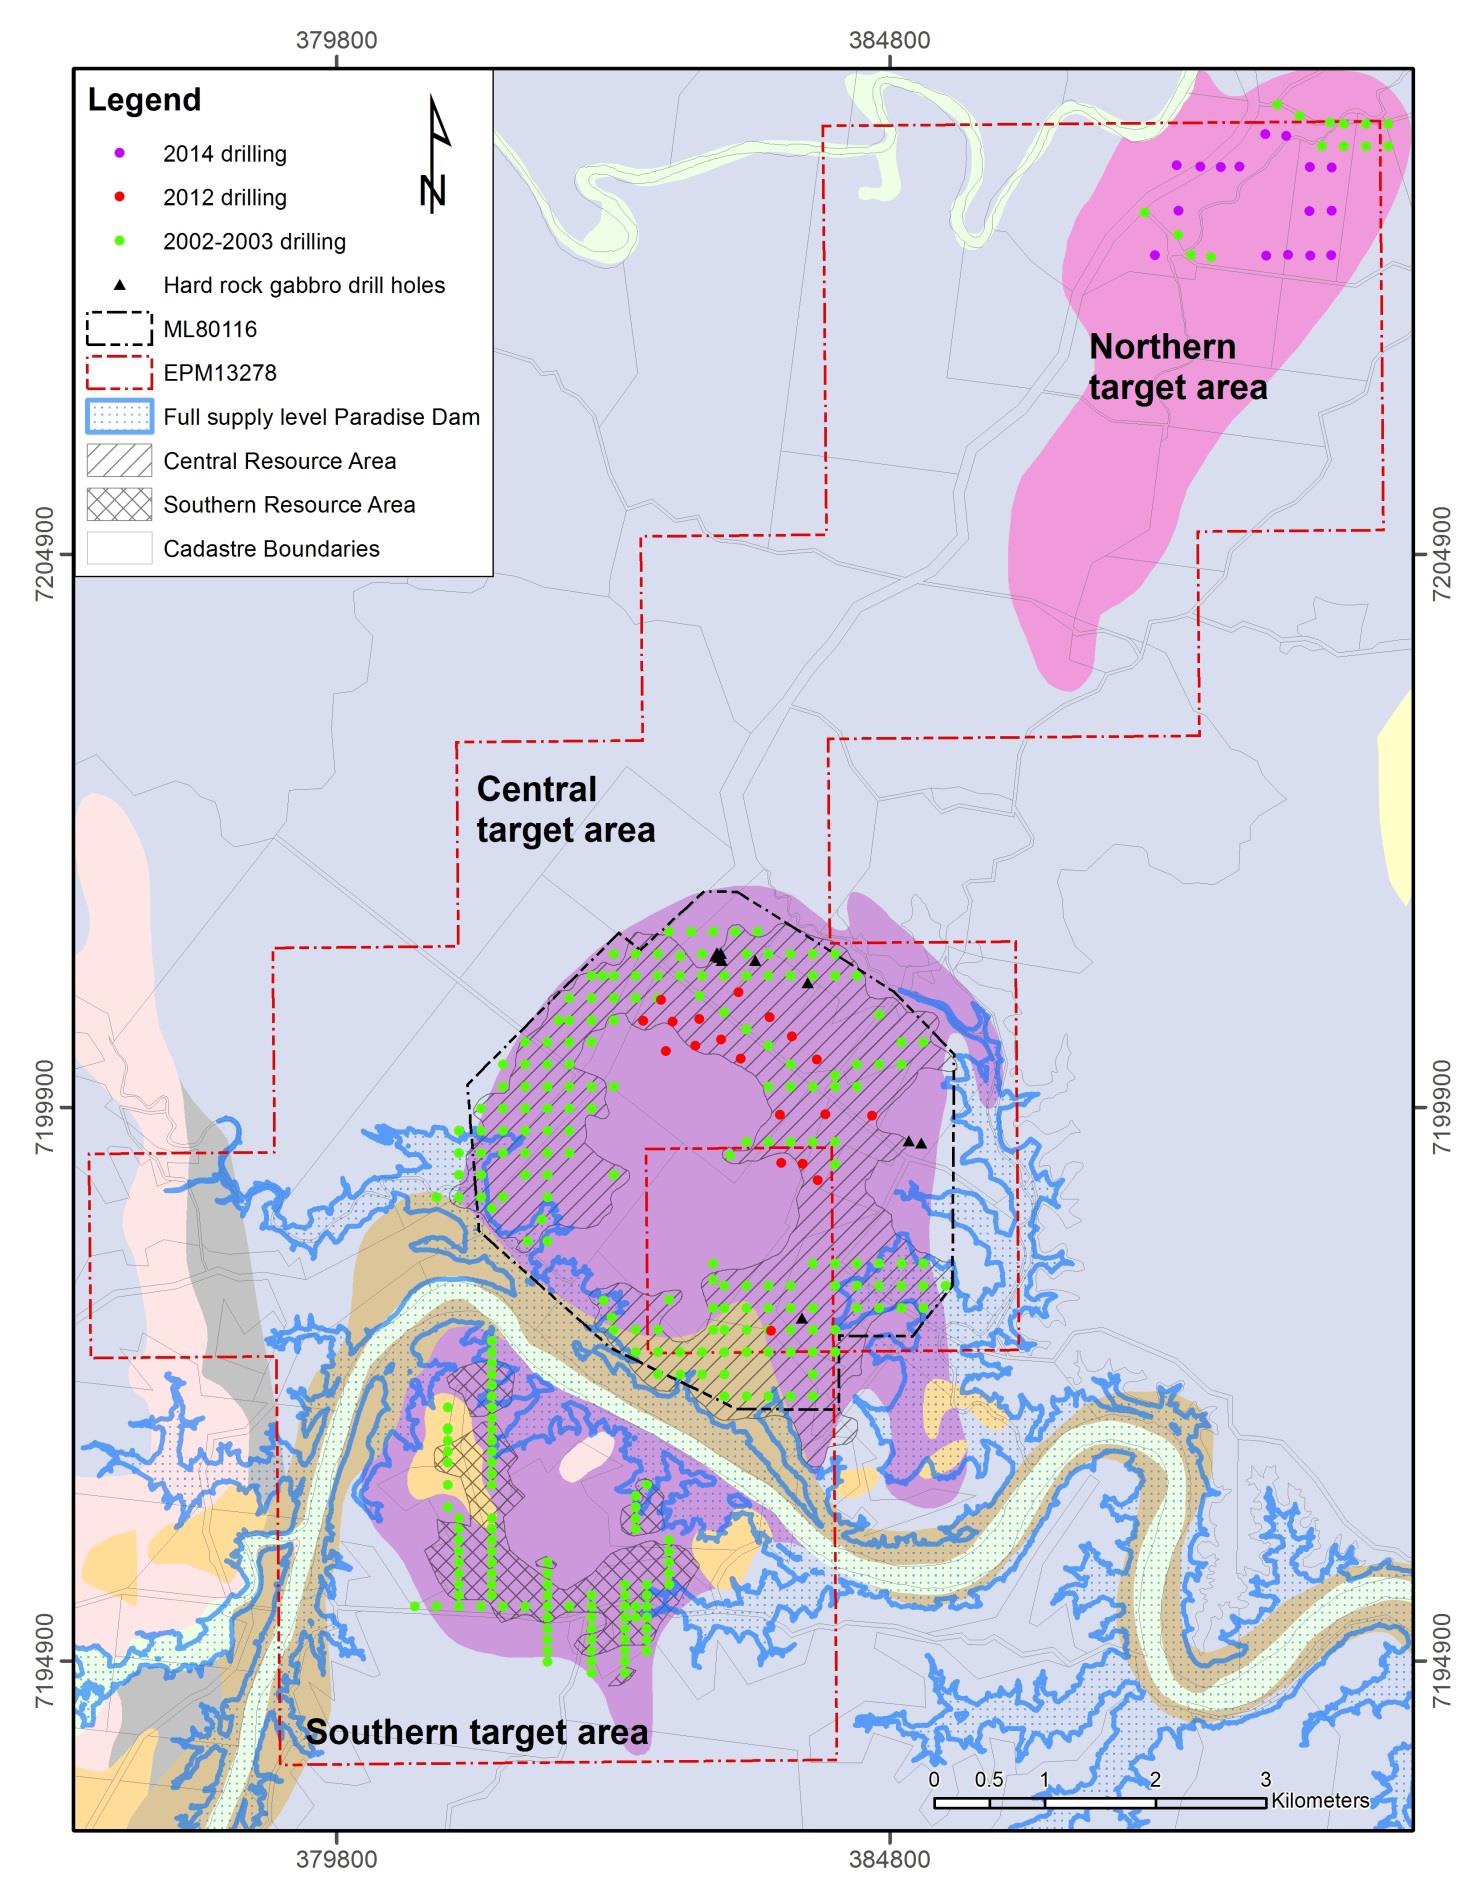
Figure 1. Drillhole and Resource Area Locations
Recent drilling in December 2012 has enabled a new estimate to be made of the resources, which now stand at:
| Area and classification | Million tonnes | Ilmenite Grade (%) |
|---|---|---|
| Central area‚ inferred | 20.0 | 4.7 |
| Southern area‚ inferred | 10.7 | 6.9 |
| Total Inferred resources: | 30.7 | 5.5 |
| Central area‚ indicated | 38.3 | 4.9 |
| TOTAL RESOURCE | 69.0 | 5.1 |
Table 1. Resource classifield in accordance with the JORC code 2012
This resource is classified in accordance with the JORC code 2012. There is exploration potential for additional eluvials in the northern area and below and around the central and southern areas, and also some hard rock exploration potential.
The Wateranga resource is sufficient for a mine life in excess of 45 years at an annual mining rate of 3-4 million tonnes.
Unconsolidated Ores:
- Total unconsolidated resource of 204,000,000t
- Proven Reserve of 58,000,000t
- Measured & Indicated Resource of 84,000,000t
- Inferred Resource of 62,000,000t
Composition of the ore:
- Ilmenite 5%
- Zircon 0.2%
- Feldspar 20%
- Apatite 0.8%
- Rutile 0.1%
Hard Rock Ores:
- Inferred Resource of 345,000,000t
- Pre Resource Mineralisation potential for additional 450,000,000t of magnetite, ilmenite, apatite, zircon hard rock ore.
Indicative composition of the ore:
- Magnetite (Iron Ore) 23%
- Ilmenite 7.3%
- Zircon 1%
- Apatite 7.7%
The hard rock resource at Wateranga has been shown to contain up to:
- Zircon 1.52%
- Apatite 12%
- Ilmenite 16%
- Magnetite 36.9%
Mineral grades based on both a ‘conservative’ and ‘selective mining’ basis are provided in the following table together with estimates of the contained tonnes of individual minerals potentially available from the Wateranga Hard Rock Resource:
| Mineral | Mineral Ore grade % (optimised) | Ore grade % (Conservative) | Contained tonnes based on Conservative grades |
|---|---|---|---|
| Zircon | 1.52 | 1 | 4‚500‚000 |
| Apatite | 12 | 7.7 | 34‚650‚000 |
| Ilmenite | 16 | 7.2 | 32‚535‚000 |
| Magnetite | 36.9 | 23 | 103‚500‚000 |
Table 2. Mineral grades from hard rock portion of “Central” northern area
The composition of the rock type in the hard rock portions of the resource bear a remarkable similarity to the Kovdor Ore Deposit in the Murmansk Region of Russia which produces; Baddeleyite (ZrO2), Apatite, Ilmenite, Magnetite and Phlogopite. Phlogopite is also known to exist at Wateranga.
An untested zone of magnetite rich skarn mineralisation has also been identified on the eastern margin of the gabbro intrusion and has been earmarked as a future drill target.
Between May 1967 and the latter part of 1970 a total of six diamond drill holes ( NS-1 to 6) for a total of almost 5000 feet were drilled under the direction of the Department of Geological Survey. Drilling by the Queensland Mines Dept. in 1970 located a deposit of magnetite, which is located near the northern boundary of High Titanium Resources and Technology Limited MDL.
Exploration for magnetite was undertaken by Danamore Pty. Ltd (1993, 1994) and New Hope Minerals Ltd. (1995, 1996). New Hope Minerals worked under a farm-in agreement to Danamore and the joint venture did ground magnetic surveys and drilling on three prospect areas within the current EPM boundary named Ryan’s Hill, Gatt’s Hill and Kallia Creek. Percussion drill hole RH3 at Ryans Hill indicated an 8 metre thick zone of 20-25% magnetite dipping south at approximately 70 degrees. Oxidation in the area had a depth of approximately 25 metres. The magnetite accumulation was interpreted to be a skarn deposit resulting from contact metamorphism around the edges of the gabbro. A limited helicopter survey was also carried out by the joint venture. A magnetic interpretation based on a ‘Geological Survey of Queensland 2005 Maryborough-Gympie’ aeromagnetic dataset flown with 400 metre line spacings 80 metres above the ground surface is shown in Figure 2.
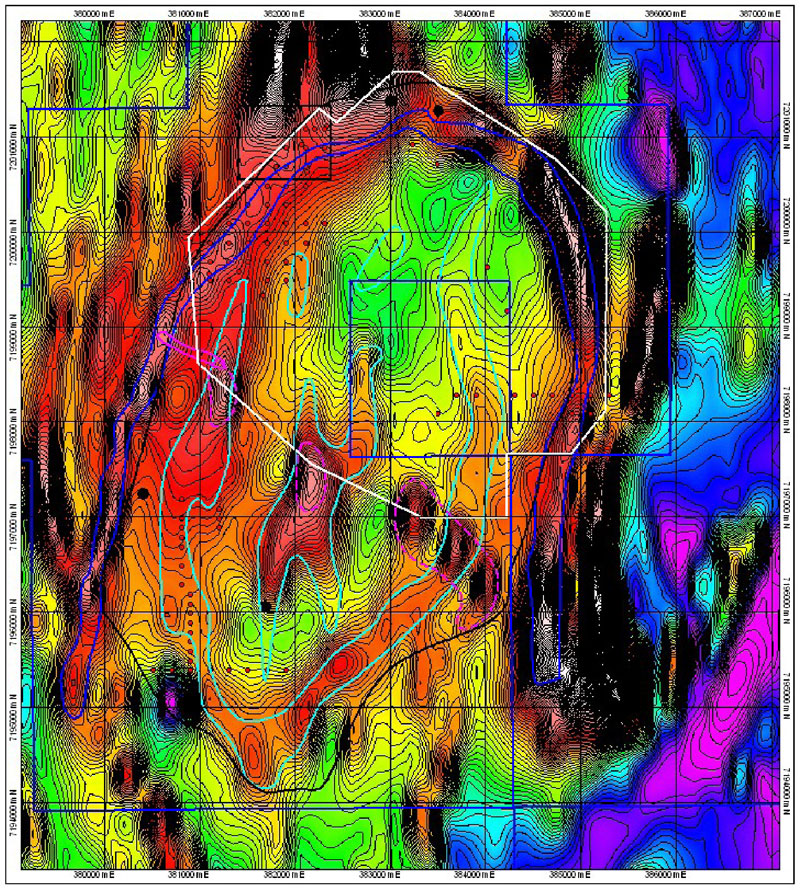
Figure 2. Magnetic interpretation on Maryborough-Gympie reduced to pole magnetic data and contoured at 10 nanotesla intervals.
| Element | Calculated average chemistry of Qld Government Mines Dept‚ HTL & Talusani samples | Average of 16 samples assayed in PhD Thesis by R.V.R Talusani 2003 |
|---|---|---|
| Fe total | >60% | 72.43% |
| SiO2 | <1% | |
| Al2O3 | 0.2% | 1.04% |
| CaO | 0.4% | |
| MgO | <1% | 0.47% |
| P2O5 | <0.05% | |
| TiO2 | >8% | 2.42% |
| V | 0.15% | |
| S | 0.01% | |
| MnO | 0.14% | |
| Cr2O3 | 0.84% |
Table 3. Titanomagnetite grades based on available samples to date
Exploration to date has shown that Wateranga has the potential to host in excess of 450 million tonnes of high magnetite ore with the above approximate grades.
In March 2003 a detailed thesis on the Wateranga layered mafic intrusion was completed by Reddy V. R. Talusani as part of a Doctor of Philosophy at the University of New England, Armidale NSW, Australia. More than 150 fresh representative surface rock samples were collected from the intrusion. In addition, extensive drill core (~850 m) examination and sampling (~200 rock samples) have been carried out. Approximately 250 samples were investigated petrographically. More than 400 mineral analyses were carried out by electron microprobe analysis at the University of New England (From R.V.R.Talusani 2003). Work conducted by Talusani using his own data and that of others resulted in the production of the Geological map of the Wateranga Layered Intrusion shown as Figure 3.
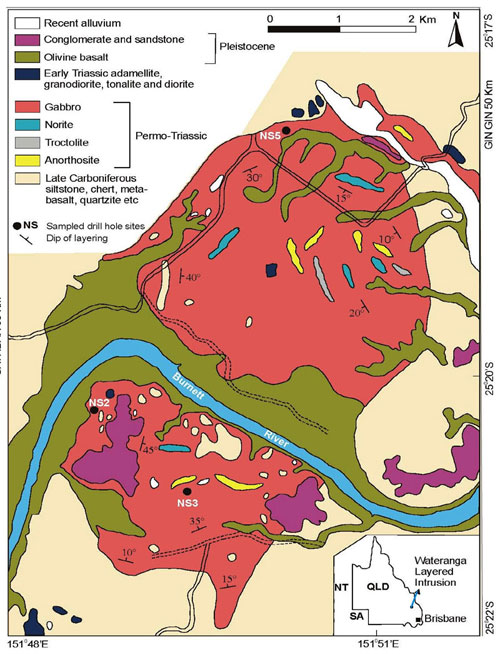
Figure 3. Geology of the Wateranga area. (From Talusani, 2003 PhD thesis. University of New England.)
Relevant observations (Talusani 2003) that came from the thesis and impact on the commercial exploitation of the Wateranga orebody include:
- There are areas of “extreme enrichment of Titanium (Ti), Phosphorus (P) and Zirconium (Zr)” at Wateranga.
- The quality of the Magnetite at Wateranga is extremely high.
- The Wateranga intrusion is similar to other rift related gabbro intrusions such as the Skaergaard intrusion and gabbro intrusions from the Oslo rift, Norway.
- Fine grained Fe-Ni-Cu sulphides occur throughout the intrusion.
- Ferrogabbro at Wateranga contains a global average of 18.2% Ilmenite + Magnetite. Significant sections of this lithology are enriched beyond the global grade.
- The Middle zone is exposed in several places but generally is hidden below a thin cover of 5m to 50m of upper zone material. This explains why the magnetics and the soil geo-chemistry have been contradictory in some cases, ie the Magnetic survey is picking up the richer Middle zone which is not exposed and therefore has not shed mineral into the soil. This increases the exploration potential of Wateranga.